
Everything You Need to Know About Fishbone Diagrams
Discover all you need to know about fishbone diagrams in manufacturing, including how to make them, their benefits, and some frequently asked questions.
What is a fishbone diagram in manufacturing?
A fishbone diagram is a visual brainstorming tool that’s used in manufacturing to detect the cause(s) of an issue. It is also commonly referred to as an Ishakawa diagram or cause-and-effect diagram. The fishbone diagram is used in manufacturing as a root cause analysis and quality defect prevention tool. It is one of the seven basic tools of quality.

What is a fishbone diagram used for in manufacturing?
A fishbone diagram is used in manufacturing to assist in the process of pinpointing the root cause of a problem. Due to its clear structure, it helps organize ideas thought up during a brainstorm. Furthermore, its categorical structure stimulates the thinking up of alternative explanations and gives the people performing the analysis an overview of the full scope of possible causes.
The pros and cons of the fishbone diagram
Pros
- Easy to make
- Organizes disparate ideas
- Great for brainstorming and thinking up alternative ideas
Cons
- Profusion of possible causes may slow down an analysis
- May tempt users to solve each possible cause
- Possible causes need to be empirically checked in order to continue the analysis
How do you make a fishbone diagram?
While reading this article, you may have wondered why this root cause analysis tool is called a ‘Fishbone diagram.’ It all comes down to the visual construction of this technique, which resembles a fish skeleton. For those among you who have little experience in drawing fish skeletons, we’ll quickly walk explain how you can create your own fishbone diagram and give you some tips on how you and your team can perform the perfect fishbone diagram analysis.
To make a fishbone diagram, all you need is a pen and paper or marker and whiteboard, or a digital brainstorming tool like Lucidspark.
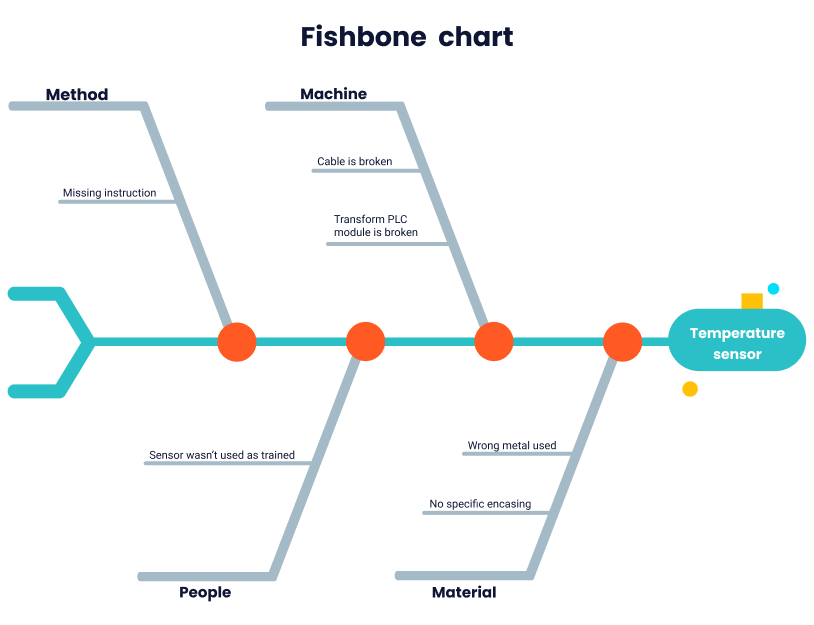
The far-right side of the diagram—to which the horizontal line points—states the problem an analysis is focused on, for example: “batches of product X occasionally contain traces of plastic.” The largest branches of the diagram are the main categories. In manufacturing, these generally consist of the four or five Ms (material, man, method, maintenance, management). The smaller branches under each category list possible causes. Under Man, for instance, a cause to this problem could be “failure to adhere to standard operating procedures.”

Tips on using fishbone diagrams in manufacturing
Looking to do your own fishbone diagram analysis? Here are some tips that will help you perform one flawlessly.
- Gather a diverse team
Since the fishbone diagram allows for the aggregating of different ideas, it’s a best practice to involve a team of people with diverse perspectives in the analysis. Even if a person isn’t directly related to the area a problem applies to, their experience and creativity may prove essential in solving the problem.
- State the problem clearly
Before you get started, make sure to state the problem the analysis is focused on. Do not formulate this as a solution, i.e. “our efficiency should be higher.” Instead, a problem could be formulated thus: “machine X is underperforming, thereby lowering our efficiency.” Using a Pareto chart can be of great value in locating or demarcating problems.
- Use the 5 Whys
To ensure your fishbone diagram contains root causes only, use the 5 Whys technique. Just like the fishbone diagram, this method is very effective and easy to use.

Frequently asked questions about fishbone diagrams
What is an Ishikawa diagram?
The term ‘Ishikawa Diagram’ is another term for the root cause analysis tool we refer to in this article as a ‘Fishbone Diagram.’ The name ‘Ishikawa’ comes from the diagram’s creator, Kaoru Ishikawa, an esteemed Japanese chemical engineer and Quality Management theorist.
Is a fishbone diagram a root cause analysis tool?
Yes, the fishbone diagram is a root cause analysis tool. It is commonly used in manufacturing to represent all possible causes of an issue in a visual, highly structured way. The fishbone diagram is considered to be one of the seven basic tools of quality.
Is the fishbone diagram a part of Six Sigma?
Yes, the fishbone diagram is commonly used in Six Sigma as a cause-and-effect analysis or root cause analysis tool. The ultimate goal of the fishbone diagram in Six Sigma is to detect and eradicate the root cause of issues and quality defects.
Share article: