
What is a Pareto chart? (Explanation, Example, Pros & Cons)
Curious about what a Pareto chart is used for in manufacturing? Learn everything you need to know about this great RCA tool here.
What is a Pareto Chart?
A Pareto chart – also called a Pareto diagram or Pareto graph – is a type of chart that orders the most important contributing factors to a problem. The Pareto chart is one of the seven basic tools of quality. It consists of a bar chart and a line graph that respectively represent the factors’ frequency of occurrence and their cumulative percentage.
Confused? Don’t worry. We’ll now dig into these components a bit more.
The bar chart consists of multiple columns that depict the categories of contributing factors. The columns are arranged in descending order, with the factors of most significance – measured in frequency or value – on the left side. The exact number of a factor’s significance is found on the left side of the chart.
The line graph indicates the cumulative percentage of the factors that make up the main problem; it will therefore always ascend and end up at 100%. The right side of the chart shows the exact percentages.
The Pareto principle
Pareto charts are based on the Pareto principle – otherwise known as the 80/20 rule –, which states that 80% of outcomes originate in 20% of causes. In manufacturing terms, we can rephrase that by saying that 80% of all defects will generally be caused by 20% of defect categories. It should be noted that the 80/20 rule is not a hard fact, but a general rule that often varies slightly.
Pareto charts are used in various sectors. In the service sector, for example, Pareto charts are applied to get perspective on such things as customer complaints. In the following paragraphs, we’ll focus on the Pareto chart’s use as a root cause analysis tool in manufacturing.

When to use a Pareto chart in manufacturing
When to use a Pareto chart
Pareto charts are most commonly used in manufacturing to
- Get perspective on which defect categories contribute most to downtime
- Single out a factor on which to focus improvement efforts
- Present your data in a neat format to share with co-workers
Pareto chart example
Pareto charts are a great way of starting off a root cause analysis, as their bar graphs show you the areas that contribute most to a problem. Let’s take the image below as an example.
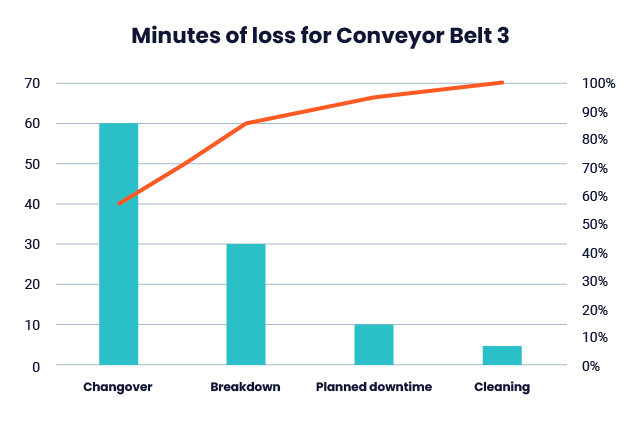
As you can see, changeovers and breakdowns account for 90 minutes of the total loss, which is about 80% of all downtime. Working on reducing changeover time and boosting MTTR could therefore be a major priority for reducing downtime.
A pro tip for using Pareto charts
It’s worth emphasizing that just because a Pareto analysis indicates that a defect category is a large contributing factor to downtime, that doesn’t mean that solving it should be your priority. It could take a lot of time and money to solve, and it might therefore be better to focus on the things that are on the right side of the graph. Making haphazard decisions based on a Pareto chart is never a good idea.
How to make a Pareto chart
Make a Pareto chart using Excel
Pareto charts can be created on virtual spreadsheet software like Excel. If you want to learn how to make a Pareto chart in Excel, we recommend you take a look at Microsoft’s useful guide, which you can find on this page.
4 Easy steps to making your own Pareto chart
You can just as well draw up a Pareto chart on a piece of paper or by using virtual drawing software. You can make one by following these steps:
1. Ensure that you have good data
The success of a Pareto analysis depends on the quality of your data. If you do not have good data, we recommend you leave the Pareto chart aside and instead use gut feeling and instinct to kick off your root cause analysis.
2. Categorize the contributing factors
Arrange the contributing factors in a set of categories and then couple these with their respective data. You can do this in a simple three-column table (you’ll need the third column in the next step). Categories should be ordered according to significance, with the most significant factors on top.
3. Add the cumulative percentage
Now it’s time to do some math. Don’t worry, you don’t need to have a degree in advanced mathematics to do this. Simply divide the total frequency number by 100 and then multiply that by the frequency of a particular factor. Enter the resulting percentages in the third column to the right of their respective factors.
4. Draw up your table
You can draw up a table in the following way:
- Draw a vertical line that represents the y-axis. Divide it up into equal parts going from zero to the total number of frequency. Tag each part with a number on the left side of the axis.
- Draw a horizontal line – the x-axis – based on the number of defect categories. Name each category below the axis.
- Draw each of the category bars on the graph based on the table you set up in the steps above.
- Draw a vertical line to the right of the bars and divide this into multiple portions that total 100%.
- Draw the line graph that represents the cumulative percentage based on your initial table.
The pros and cons of the Pareto chart
Pros:
- Easy to make and interpret, even for people without statistical knowledge
- Great way of starting a root cause analysis
- Gives insight on which causes are of most significance to a problem
Cons:
- Needs to be fed with good data to be effective
- Defect categories with most significance might be difficult to solve
Pareto charts are often used in combination with other tools to find out the root cause of a problem. In this blog post, we detail our 4 favorite root cause analysis tools.
Curious about the manufacturing trends that are shaping the future?

Share article: